
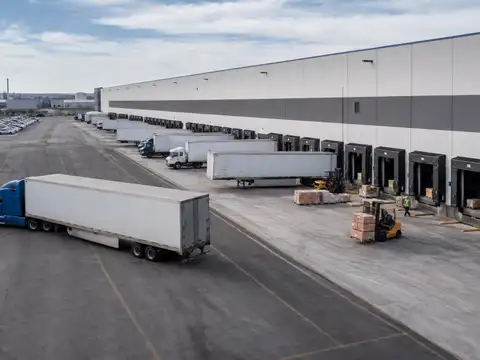
A warehouse needs enough dock doors to absorb its peak occupied-trailer workload without creating a persistent queue—and no more doors than the operation can actually stage, staff and use.
Start with trucks in the busiest operating window and measured dock-occupation time. Convert those into concurrent door demand. Then test arrival bunching, dedicated inbound/outbound requirements, staging depth, yard capacity, equipment compatibility, maintenance downtime and future scenarios.
Four shortcuts that can produce the wrong dock count
Two same-size warehouses can have radically different truck volume, dwell time, receiving profile and outbound flow.
Daily averaging hides appointment waves, carrier cutoffs and shift-change peaks.
A door with no headroom cannot absorb late trucks, long unloads, maintenance or short-term arrival surges.
Adding doors can simply move the bottleneck indoors if pallets have nowhere to stage or forklifts cannot circulate.
The basic dock-count equation
Example:
- 12 inbound trucks over the busiest 4 hours;
- 60 minutes of average occupied dock time.
12 ÷ 4 × 1.0 =
3.0 inbound doors occupied on average during that peak window.
If outbound simultaneously has:
- 10 trucks over the same 4 hours;
- 45 minutes of average occupied dock time;
then:
10 ÷ 4 × 0.75 =
1.875 outbound doors occupied on average.
Combined base demand:
4.875 concurrent occupied doors.
Why you should not build exactly 4.875 doors
The equation produces an average concurrent workload for the modeled peak window.
Trucks do not arrive:
- perfectly evenly;
- with identical service times;
- with zero appointment error;
- with zero equipment downtime.
The capacity plan needs explicit headroom.
The calculator lets you select a target utilization rather than hard-coding one.
Peak-window dock sizing
Warehouse Loading Dock Count Calculator
Convert peak inbound/outbound truck workload into occupied dock-hours, then compare pooled versus dedicated-door planning. This is a deterministic capacity screen—not a stochastic queueing simulation or building-design approval.
Average simultaneous occupied-door demand before utilization headroom.
Inbound + outbound share a flexible door pool; observed concurrency can set a higher floor.
Inbound and outbound each round up separately, which can require more doors.
Base concurrent workload ÷ available modeled pooled doors after explicit offline allowance.
Arrival bunching, appointment lateness, long-tail unloads, shift changes, trailer compatibility and staging congestion can require more capacity. Validate the result against timestamped arrivals, dock occupancy and queue history before committing to building geometry.
What “occupied dock time” should include
Measure the period during which the dock position is not realistically available to the next trailer.
Depending on the process, that can include:
- spotting/alignment;
- vehicle restraint or chock confirmation;
- door opening;
- leveler deployment;
- loading/unloading;
- paperwork or inspection while the trailer remains at the door;
- leveler storage;
- door closure;
- restraint release;
- trailer pull-away before the next trailer can occupy the position.
Do not use:
forklift travel time inside the trailer
as though it were the entire door-occupation time.
Measure dock occupation instead of estimating it from memory
Rite-Hite ONE's current platform describes the operational data worth capturing:
- trailer arrival/departure timestamps;
- dock dwell time;
- active loading;
- actual dock utilization;
- idle dock positions.
You do not need that particular software to use the method.
Equivalent data can come from:
- YMS;
- WMS/TMS timestamps;
- appointment system;
- dock sensors;
- manual time study.
Use the peak window—not the average day
A warehouse may receive:
40 trucks/day.
That number is almost useless for dock sizing unless you know:
- when they arrive;
- how long they occupy doors;
- how inbound overlaps outbound;
- whether appointments bunch around carrier cutoffs.
Build:
- 15-minute or 30-minute arrival profile;
- occupied-door time distribution;
- maximum simultaneous door demand;
- queue/waiting profile.
Then select:
the busiest representative design window.
Average service time can also hide the real problem
Imagine:
- 70% of inbound trailers unload in 35–45 minutes;
- 20% take 60–75 minutes;
- 10% take 2+ hours.
A single 55-minute average may understate the queue created by the long tail.
Split the data by:
- load type;
- carrier;
- floor-loaded vs palletized;
- inspection requirement;
- SKU complexity;
- live load vs dropped trailer.
Inbound and outbound doors: dedicated or pooled?
One flexible door pool serves inbound and outbound.
Pooling can reduce total doors because the two demand streams share unused capacity and only round up once.
Inbound and outbound capacity is reserved separately.
This can require more doors because each stream gets its own peak capacity, but it can simplify staging, flow and accountability.
Dedicated core + flex doors for peaks.
A common planning logic is to protect core inbound/outbound flow while allowing selected positions to switch roles during peaks.
Why dedicated doors can require more capacity
In the calculator example:
- inbound average concurrent demand = 3.0;
- outbound average concurrent demand = 1.875;
- target utilization = 80%.
If pooled:
ceil(4.875 ÷ 0.80) =
7 doors.
If fully dedicated:
- inbound = ceil(3.0 ÷ 0.80) = 4;
- outbound = ceil(1.875 ÷ 0.80) = 3.
Total:
7 doors.
In another volume mix the two methods can differ because:
each dedicated stream rounds up separately.
Observed simultaneity can override the average formula
If the formula says:
7 pooled doors
but 12 months of reliable appointment/yard data repeatedly shows:
9 trailers simultaneously needing dock service,
then:
the calculator should not talk you back down to 7.
This is why it contains:
Observed maximum simultaneous trailers needing a dock.
Use it only when the observation is genuinely representative.
Dock utilization is not the same as trailer dwell time
Track both.
- Dock utilization asks how much of available dock time is actively/operationally occupied.
- Trailer dwell time asks how long the trailer spends at or around the dock process.
Rite-Hite ONE currently treats both as distinct operational measurements.
A facility can have:
- high trailer dwell;
- low active loading time
if paperwork, staging or scheduling causes trailers to hold doors while little productive transfer occurs.
Before adding doors, reduce occupied time
Because dock count scales with occupied time:
Potential causes of avoidable dock occupation include:
- load not staged before trailer arrival;
- paperwork delays;
- waiting for forklift/operator;
- waiting for QA inspection;
- poor pallet sequence;
- blocked staging;
- door assignment delays;
- equipment downtime.
MHI's 2026 warehouse KPI guidance identifies:
dock-to-stock cycle time as an important inbound-flow KPI.
It measures how long incoming goods take to move from dock to available inventory.
That is not the same metric as trailer occupancy, but it can reveal downstream receiving friction that keeps dock staging congested.
Staging can cap usable dock count
Rite-Hite's loading-dock design guidance says staging should be designed around:
- trailers served;
- product moved.
For standard 53–57-ft over-the-road trailers carrying full loads, Rite-Hite notes that the staging area may need at least:
53–57 ft of depth to drop product.
The same guidance says many big-box distribution centers use:
at least 75 ft of staging depth to accommodate forklift traffic plus loading/unloading.
Treat these as:
vendor design examples—not a universal warehouse requirement.
The important lesson is:
every additional active dock position creates:
- staging demand;
- forklift travel;
- pedestrian/traffic interactions;
- space for controls and safety equipment.
Door count and staging capacity must be solved together
If one full inbound trailer requires:
26 pallet positions of temporary staging,
then six simultaneously unloading trailers can require:
156 pallet staging positions
before allowing for:
- travel aisles;
- QC/exception product;
- empty pallets;
- returns;
- outbound overlap.
This is why a dock-door expansion can fail to improve throughput if interior flow is not expanded with it.
The Warehouse Layout Mistakes That Reduce Capacity guide covers this false-capacity problem.
Yard capacity can become the next bottleneck
More docks can increase:
- simultaneous trailer arrivals;
- yard moves;
- spotting activity;
- tractor/driver demand;
- trailer queues.
Track:
- gate-to-dock time;
- yard dwell;
- spotter moves;
- available staging/drop spaces;
- missed appointment slots.
A building can have spare dock doors and still suffer:
poor truck throughput
because trailers cannot reach the right door at the right time.
Dock equipment can make two doors operationally non-equivalent
Door 12 may not be interchangeable with Door 13 if they have different:
- leveler type/capacity;
- trailer-height range;
- vehicle restraint compatibility;
- seal/shelter envelope;
- door opening;
- electrical/controls;
- temperature-control zone.
Use:
to map the equipment constraints that determine whether a door can really be pooled.
Commercial door downtime can reduce usable dock count
If the building has:
10 physical dock doors
but one high-cycle door is repeatedly out of service,
the operational capacity is:
less than 10.
Use the Commercial Loading Dock Door Replacement Cost and Loading Dock Maintenance Cost guides when unreliable assets are reducing effective dock availability.
Dock lifts should not be counted like ordinary leveler doors
A truck scissor dock lift has:
- vertical travel time;
- platform loading/unloading time;
- bridge/transition sequence;
- different capacity/throughput mechanics.
Its validated:
loads per hour
should be modeled separately.
See:
Safety can limit how aggressively you use dock capacity
OSHA's current powered-industrial-truck loading-dock guidance identifies hazards including:
- falling off the dock edge;
- skidding/slipping;
- tail swing;
- pedestrian interactions.
OSHA recommends:
- maintaining safe distance from dock edges;
- keeping working surfaces clear and clean;
- watching for pedestrians;
- slowing in congested areas.
More doors active at once can increase:
- forklift crossings;
- staging congestion;
- pedestrian exposure;
- traffic density.
The calculator estimates workload capacity only. It does not approve dock spacing, truck-court geometry, forklift/pedestrian separation, fire protection, door clearances, dockboard/leveler safety or vehicle restraint procedures. Capacity that cannot be operated safely is not usable capacity.
OSHA 1910.176 also matters around the dock interior
Where mechanical handling equipment is used, OSHA 1910.176(a) requires:
sufficient safe clearances:
- in aisles;
- at loading docks;
- through doorways;
- where turns/passage occur.
It also requires aisles/passageways to be:
- clear;
- in good repair;
- appropriately marked.
Therefore:
increasing active door count by squeezing staging/traffic lanes
is not a legitimate capacity improvement.
Three warehouse scenarios
Pooled doors can reduce capital needs if staging zones and equipment can switch roles without disrupting flow.
Flexible doors may shift from receiving to shipping later in the day, but clean staging conversion and appointment control are essential.
Dedicated-door calculation is more relevant even if the arithmetic produces a higher total count.
Do not size tomorrow's building from last year's average
Run at least:
- current peak scenario;
- expected near-term peak scenario;
- future growth scenario;
- stress scenario for a major customer/product change.
Change:
- truck counts;
- service minutes;
- inbound/outbound overlap;
- door availability;
- pooling assumption.
Do not simply add:
20% more dock doors
because volume is expected to grow 20%.
Better scheduling or faster service can offset some volume growth; a change to floor-loaded trailers can increase service time faster than truck count.
Future growth should be translated into peak workload
If annual volume grows:
ask whether the future peak window changes by:
- more trucks;
- longer loads;
- more appointment concentration;
- more trailer variety;
- more outbound cutoffs;
- additional shifts.
The How Much Warehouse Space Do You Need? article applies the same principle to facility sizing:
future peak workload should drive planning assumptions.
When adding doors is probably the wrong first move
Investigate process before construction when:
- doors sit idle while trailers queue elsewhere;
- staging is full;
- trucks wait for paperwork;
- forklifts wait for product;
- door assignment is slow;
- one equipment type creates a bottleneck;
- long-tail loads dominate occupied time;
- maintenance downtime is excessive.
Rite-Hite's current dock-management materials explicitly focus on:
- dock dwell time;
- dock utilization;
- idle doors;
- bottlenecks;
- trailer arrival/departure data.
Those are the measurements to examine before building more wall openings.
When more doors probably deserve serious analysis
Expansion becomes more credible when:
- peak doors are consistently near the facility's chosen operational limit;
- queues persist even with disciplined appointment scheduling;
- occupied-time reduction opportunities have been addressed;
- staging/yard can support more simultaneous flow;
- equipment and labor are available;
- future peak demand materially exceeds existing capacity;
- maintenance/resilience requires some physical capacity to be unavailable.
Data to collect before finalizing dock count
| Data | Why it matters | Suggested segmentation |
|---|---|---|
| Trailer arrivals | Defines peak arrival waves and appointment bunching. | 15/30-min interval · inbound/outbound · carrier |
| Dock occupied time | Converts truck volume into concurrent door demand. | load type · trailer type · dock · shift |
| Queue/wait time | Shows whether current capacity/service process is already failing. | gate · yard · pre-dock · dock |
| Active loading time | Separates productive transfer from idle occupancy. | inbound/outbound · process |
| Dock utilization | Shows high-use, low-use and imbalance across doors. | door · hour · shift · weekday |
| Staging occupancy | Tests whether more active doors can actually be supported inside. | inbound/outbound · pallet positions · peak |
| Equipment downtime | Converts physical doors into effective available doors. | door · asset · planned/unplanned |
| Trailer compatibility | Determines whether doors are truly interchangeable. | height · RIG · door · seal/shelter · leveler |
Validate the proposed count with a schedule replay
Before construction:
- Take several representative peak days.
- Replay the actual trailer arrivals.
- Use measured service-time distributions.
- Apply the proposed door assignments.
- Block doors for expected maintenance/constraints.
- Observe queue length and wait time.
For larger projects:
use discrete-event simulation or equivalent operational modeling.
The calculator is:
a first sizing screen.
It is not a substitute for:
queueing/simulation analysis when capital decisions are large.
Physical loading dock design still needs a reality check
Rite-Hite's current architectural loading-dock guidance emphasizes:
- specific application;
- standards/safety;
- budget;
- building constraints;
- footprint challenges;
- future growth.
It also says:
there is no one-size-fits-all loading dock design guide.
That is the correct final check for dock count too.
Loading dock count planning audit
- Peak inbound trucks by 15/30-minute interval.
- Peak outbound trucks by 15/30-minute interval.
- Representative peak planning window.
- Inbound occupied dock time distribution.
- Outbound occupied dock time distribution.
- Long-tail / exception service times.
- Observed maximum simultaneous dock demand.
- Current queue and wait-time profile.
- Current dock utilization by door and hour.
- Chosen target planned utilization and rationale.
- Inbound/outbound dedicated vs pooled strategy.
- Trailer compatibility by dock.
- Leveler compatibility.
- Vehicle-restraint compatibility.
- Door-opening compatibility.
- Seal/shelter compatibility.
- Temperature/security segregation.
- Inbound staging requirement.
- Outbound staging requirement.
- Forklift travel/circulation capacity.
- Pedestrian separation.
- Yard/drop-space capacity.
- Spotter/yard-tractor capacity.
- Planned maintenance door downtime.
- Unplanned availability history.
- Current peak scenario.
- Future peak scenario.
- Stress scenario.
- Schedule replay / simulation result.
- Final physical dock count.
Model dock count from throughput and dwell time
The previous loading-dock calculators answer:
- what equipment costs;
- what a commercial door replacement costs;
- what a dock lift project costs;
- what annual maintenance costs.
This article answers a different question:
how much simultaneous dock capacity the operation requires.
The relationship between:
- peak truck rate;
- occupied dock time;
- planned utilization
is objective enough to calculate.
The calculator still exposes:
- utilization assumption;
- observed concurrency;
- pooled vs dedicated logic;
- explicit unavailable-door allowance
so it does not pretend to deliver false precision.
The decision rule
Size loading docks from the busiest operating window. Convert truck arrivals and measured occupied dock time into concurrent door demand, then add explicit headroom and validate against actual simultaneity. Decide whether inbound and outbound can truly share doors. Finally, stress-test staging, yard, equipment, maintenance availability, safe traffic flow and future peak scenarios. If the proposed doors cannot be staged, staffed or operated safely, they are not real capacity. If the current doors are idle while trailers wait elsewhere, fix the process before building more openings.
Frequently asked questions
How many loading docks does a warehouse need?
There is no universal doors-per-square-foot answer. Estimate concurrent occupied dock demand from peak truck volume and measured dock-occupation time, add facility-specific headroom and validate the result against queue, staging, yard and future-volume data.
How do you calculate the number of dock doors needed?
A useful first screen is peak truck arrival rate multiplied by average occupied dock time. Divide that concurrent demand by the facility's chosen target utilization, round up and then test observed simultaneity and operational constraints.
How many dock doors per 100,000 square feet?
Square-footage ratios can be descriptive portfolio benchmarks but are weak sizing formulas. Truck volume, service time, inbound/outbound overlap, staging and yard constraints determine operational door demand.
What dock utilization should a warehouse target?
There is no universal target. Rite-Hite ONE published a 2025 marketing benchmark describing 70–85% as healthy dock utilization, but that is not an OSHA/ANSI design requirement. Set a target from your arrival variability, queue tolerance and operating data.
Should inbound and outbound docks be separate?
Not always. Pooled doors can reduce physical count when the doors, staging, equipment and workflows are genuinely interchangeable. Dedicated doors can be better where flows, security, temperature, equipment or layout require segregation.
How does trailer unload time affect dock count?
Directly. At the same truck arrival rate, longer occupied dock time increases concurrent door demand. Measure total spot-to-release occupancy rather than only active forklift handling time.
Should I use average daily trucks to size loading docks?
No. Daily averages can hide concentrated appointment waves. Use a representative peak window and analyze arrival bunching and simultaneous demand.
How much staging space is needed behind loading docks?
It is application-specific. Rite-Hite's design guidance says 53–57-ft full-load trailers can imply at least 53–57 ft of staging depth and notes many big-box distribution centers use at least 75 ft to include forklift traffic. Treat those as vendor design examples, not universal requirements.
Can adding dock doors increase warehouse throughput?
Yes when dock capacity is the real bottleneck and staging, labor, yard and equipment can support more simultaneous trailers. If the bottleneck is paperwork, staging, scheduling or handling labor, additional doors may sit idle.
What data should I collect before adding loading docks?
Collect trailer arrivals, occupied dock times, active loading time, queue/wait time, dock utilization, staging occupancy, equipment downtime and trailer-to-door compatibility by shift and peak period.
How should future growth be included?
Run future peak scenarios with the expected truck count, service-time distribution, inbound/outbound overlap and operating shifts. Do not assume dock count must grow in the same percentage as annual volume.
Does OSHA specify how many loading docks a warehouse needs?
The OSHA sources used in this guide address safe loading-dock operation, mechanical-handling clearances and dock hazards rather than a warehouse throughput formula for door count. Capacity planning still must preserve the applicable OSHA safety requirements.
Sources and methodology
Warehouse Fieldbook's dock-count calculator is an original deterministic workload-screening model: peak truck rate multiplied by measured occupied dock time produces average concurrent dock demand; target utilization adds explicit headroom; observed simultaneous demand can impose a higher floor; and the model reports pooled and dedicated inbound/outbound scenarios separately. It is not presented as an ANSI, OSHA or manufacturer formula. Rite-Hite's current design guidance supports application-specific dock planning, building/future-growth review and staging design; its ONE platform supports measurement of trailer timestamps, dwell, active loading, idle docks and utilization. Rite-Hite ONE's 2025 70–85% utilization figure is explicitly treated as a vendor marketing benchmark rather than an engineering rule. MHI's March 2026 warehouse KPI guidance supports dock-to-stock measurement. Blue Giant's current industry page supports the relationship between high-volume throughput, multiple dock positions, short dwell and continuous-duty operating cycles. OSHA's current powered-industrial-truck loading-dock guidance and 1910.176 provide the dock-edge, traffic and mechanical-handling clearance boundaries used in the article.
- Rite-Hite — Designing the Right Loading Dock for Your Operation
- Rite-Hite — current loading dock design and construction guidance
- Rite-Hite ONE — current dock dwell, utilization, active-loading and idle-door measurements
- Rite-Hite ONE — 2025 facility metrics and vendor dock-utilization benchmark
- Rite-Hite ONE — current operations/dock visibility and throughput use cases
- MHI — 2026 warehouse KPI guidance including dock-to-stock cycle time
- Blue Giant — current high-volume warehouse/transportation dock operating context
- OSHA — powered industrial truck loading-dock hazards and recommended practices
- OSHA — 29 CFR 1910.176 loading dock, doorway and aisle clearances