
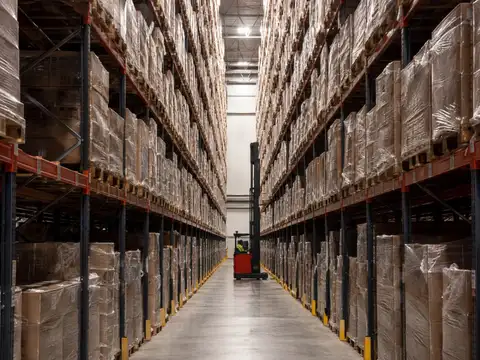
Warehouse storage density is the amount of usable storage capacity created inside a defined amount of space.
For pallet warehouses, the cleanest operating metric is usually installed pallet positions per 1,000 ft² of the defined storage zone. Use the same boundary for every scenario. Then track occupancy separately so a fuller warehouse is not mistaken for a denser warehouse.
Density scoreboard
One warehouse can look “dense” under one metric and inefficient under another.
Use the same denominator every time you compare layouts. Building area, storage-zone area and rack footprint answer different questions.
Best for comparing how many installed pallet locations a defined storage zone creates.
Shows how much of the building is allocated to the storage function rather than docks, staging, offices or processing.
Highlights buildings where floor space is constrained but clear height remains underused.
Measures how full the operating storage system is. It is not the same thing as physical storage density.
The simplest warehouse storage density formula
Suppose an existing storage zone contains:
- 4,320 installed pallet positions;
- 50,000 ft² assigned to the rack storage zone, including its working aisles.
The density is:
4,320 ÷ 50,000 × 1,000 = 86.4 pallet positions per 1,000 ft².
That number can now be compared with a redesign of the same zone, provided the revised scenario uses the same area boundary.
If you need to translate this ratio into the reciprocal footprint metric, the pallet positions per square foot guide shows how positions per 1,000 ft² and square feet per stored pallet describe the same layout from opposite directions.
Start with the capacity count, not the density ratio
The previous Warehouse Fieldbook guide explains how to count physical pallet locations from:
- rack faces;
- bays per face;
- positions per bay and level;
- storage levels;
- depth positions.
If that count is not reliable, the density ratio will not be reliable either. Use the warehouse storage capacity method and calculator first, then divide the verified physical position count by a clearly defined area.
Do not mix four different warehouse utilization metrics
Installed pallet positions per unit of storage-zone floor area. Best for comparing storage layouts.
Net storage-zone area divided by gross building area. Best for understanding how much floor space the storage function receives.
Actual used storage height divided by the safely usable storage height. Best for identifying unused cube.
Stored pallets divided by usable operating positions. Best for measuring fullness, not physical layout density.
Storage density and occupancy are not the same thing
Imagine two warehouses with identical rack layouts:
- each has 4,000 usable pallet locations;
- each uses the same 50,000 ft² storage zone.
They have the same physical storage density.
If Warehouse A stores 2,000 pallets and Warehouse B stores 3,700 pallets, Warehouse B has much higher occupancy—but it is not physically denser.
Keeping these metrics separate matters because layout projects change density, while inventory and slotting policies change occupancy.
Do not use one universal “ideal occupancy percentage”
There is no single percentage that makes every pallet warehouse efficient.
The operating buffer required depends on:
- SKU count;
- pallets per SKU;
- lot and date segregation;
- FIFO or FEFO requirements;
- fixed versus random locations;
- replenishment rules;
- seasonal inventory;
- quality-hold inventory;
- empty-pallet and reserve locations;
- how often pallets move between slots.
A warehouse can have open pallet positions and still struggle to put away a particular SKU because the remaining positions are incompatible with its location rules, pallet dimensions, weight or rotation requirement.
Measure storage-area share separately
Gross warehouse floor area can also contain:
- receiving docks;
- shipping docks;
- inbound staging;
- outbound staging;
- packing;
- value-added services;
- battery charging;
- maintenance;
- offices;
- employee areas;
- cross aisles and other circulation.
A redesign that increases the percentage of floor dedicated to storage may add pallet capacity, but it can also remove space required to receive, stage, pick and ship those pallets.
A 100,000 ft² warehouse example
One building, five numbers that explain its storage profile.
The location-density calculation is:
5,220 ÷ 58,000 × 1,000 = 90 pallet positions per 1,000 ft².
If a new layout creates 6,380 positions inside the same 58,000 ft² zone, its density becomes 110 positions per 1,000 ft².
The increase in physical density is:
In this example:
(110 − 90) ÷ 90 × 100 = 22.2% higher location density.
That is a layout result. It still does not prove that the new system will have better throughput, lower labor cost or better SKU access.
Density is a trade-off, not the warehouse objective
A warehouse exists to move and protect inventory, not merely to hold the highest theoretical number of pallets.
Increasing density can affect:
- selectivity;
- forklift travel;
- pallet access;
- rehandling;
- FIFO capability;
- throughput;
- congestion;
- fire-protection design;
- capital cost;
- maintenance complexity.
The density ladder: where extra pallet positions usually come from
Recover unused vertical space
Additional approved rack levels can increase pallet positions without reducing aisle count, provided load heights, rack engineering, lift height, sprinkler clearances and other building constraints permit them.
Narrow the working aisles
Aisle reduction can create room for more rack rows, but the handling equipment must be capable of safely operating in the resulting aisle.
Store pallets more than one position deep
Double-deep, push-back, drive-in, pallet flow and shuttle systems can reduce aisle exposure per pallet position and raise density.
Automate the storage architecture
AS/RS can use height, tighter geometry and machine-controlled movement to create a very different relationship between access aisles and storage.
Aisle width is one of the strongest density levers
Every rack row needs an access strategy.
Wider aisles consume floor area but can suit conventional forklift movement. Narrower or very-narrow aisles can create space for additional rack rows, but they change the required truck, guidance, travel pattern and operating envelope.
Manufacturer guidance shows that aisle requirements can change materially between counterbalanced, reach and very-narrow-aisle equipment. The exact dimension must come from the selected truck, load and operating geometry. Use the Warehouse Aisle Width Guide to calculate and validate that operating envelope before treating narrower aisles as available storage space.
Manufacturer examples are useful for understanding the mechanism, not as universal design dimensions.
OSHA 29 CFR 1910.176(a) requires sufficient safe clearances wherever mechanical handling equipment travels or turns, and requires aisles and passageways to be kept clear and appropriately marked. Do not reduce aisle width from a density spreadsheet without validating the actual truck, load, rack, turning geometry and site safety requirements.
Double-deep storage shows why aisle count matters
Single-deep selective rack needs an access aisle beside each accessible rack face. Double-deep storage puts another pallet position behind the first, reducing the number of access aisles required for a given number of pallet locations.
Raymond currently states that its Deep-Reach approach can eliminate two aisles out of every five compared with single-deep storage in the configuration it describes.
That is useful evidence of the mechanism—not a promise that every warehouse receives the same percentage gain.
Double-deep can also reduce direct selectivity and requires compatible reach equipment.
High-density rack reduces aisle exposure per pallet
Drive-in, push-back, pallet-flow and pallet-shuttle systems place multiple pallets in depth.
Interlake Mecalux describes compact/high-density systems as architectures that reduce operating aisles and use deeper storage channels to increase capacity.
But physical density can diverge from effective usable capacity.
Deep-lane systems work best when the SKU profile can actually fill lanes. A lane capable of holding eight pallets does not create eight useful positions for every operation if the warehouse routinely has only two or three pallets per SKU.
Measure effective density when lanes create honeycombing
Installed density counts every physical position.
Effective density removes positions that are predictably unavailable because of:
- SKU-lane dedication;
- FIFO/FEFO separation;
- lot separation;
- blocked locations;
- permanent reserve;
- incompatible pallet dimensions;
- weight restrictions;
- quality holds;
- other recurring operating constraints.
This prevents a high-density design from receiving credit for positions the inventory profile cannot realistically use.
Vertical utilization is the second density axis
Do not use building clear height blindly as the denominator.
Usable storage height can be constrained by:
- sprinklers and required clearances;
- roof structure;
- lighting;
- HVAC;
- rack design;
- floor and seismic design requirements;
- forklift lift height and residual capacity;
- load height;
- automation envelope.
The value of the metric is not to declare unused height automatically available. It is to identify whether vertical engineering deserves investigation before the company leases more floor space.
Cube utilization can be useful—but it is easy to fake
A volume metric can be written as:
The problem is the definition of “storage cube.”
If one analysis counts:
- air above staging;
- dock doors;
- aisles;
- sprinkler clearance;
- offices
while another excludes them, the percentages are not comparable.
For everyday pallet-layout decisions, positions per 1,000 ft² is often easier to audit against a drawing and physical rack count.
Density should be measured by storage family
Do not average unlike storage systems too early.
A mixed warehouse may contain:
- selective pallet rack;
- double-deep rack;
- pallet flow;
- floor stack;
- carton shelving;
- mezzanine storage;
- AS/RS.
Calculate each zone separately first.
Then create a whole-building summary.
Compare density and selectivity together
Direct pallet access can be worth more than additional positions when the warehouse has many SKUs, low pallets per SKU or high retrieval variability.
High pallets per SKU and predictable rotation can make deeper lanes materially more efficient than selective rack.
Automation can change aisle geometry and vertical use, but the business case still depends on transactions, integration, redundancy and capital cost.
Do not optimize density before mapping throughput
A layout can add pallet positions while making the warehouse worse.
Test:
- receipts per hour;
- putaways per hour;
- picks or pallet retrievals per hour;
- replenishments;
- travel distance;
- cross-aisle congestion;
- dock-to-stock time;
- truck queuing;
- peak-hour behavior.
If a density project creates more rehandling or longer retrieval paths, extra capacity can be consumed by labor and service penalties.
A good density comparison uses the same SKU snapshot
Compare layouts against the same:
- SKU list;
- pallet dimensions;
- pallet weights;
- inventory by SKU;
- peak inventory;
- turnover;
- FIFO/FEFO rules;
- lot constraints;
- throughput requirement.
Otherwise one design can appear better simply because it was tested against an easier inventory profile.
Use peak inventory, not average inventory, for capacity stress tests
Average inventory can hide the week in which:
- seasonal stock arrives;
- inbound exceeds outbound;
- promotions build inventory;
- returns accumulate;
- quality holds increase.
Density tells you what the layout can physically create.
Peak inventory tells you whether that created capacity is enough.
Density improvement should have a capital metric
Example:
- layout project cost: $420,000;
- old usable positions: 5,000;
- new usable positions: 6,200;
- net added positions: 1,200.
$420,000 ÷ 1,200 = $350 per net added operational position.
This does not replace a complete ROI analysis, but it allows several space optimization proposals to be compared on a consistent capacity basis.
Compare added density with the cost of more building space
When a warehouse is approaching its practical capacity, the strategic choices may include:
- re-slotting;
- adding rack levels;
- changing lift trucks and aisle width;
- converting a zone to double-deep or compact storage;
- automating;
- adding mezzanine space for compatible inventory;
- expanding the building;
- leasing overflow space;
- moving facilities.
A density project should therefore state:
- net usable positions gained;
- project CAPEX;
- throughput effect;
- labor effect;
- equipment changes;
- how many years of growth capacity it buys.
Do not count staging as “wasted space” automatically
Staging supports:
- dock flow;
- receiving inspection;
- load consolidation;
- route sequencing;
- cross-docking;
- outbound buffer.
Converting staging to rack can increase storage-area share and location density while reducing dock productivity.
The correct question is not:
“Can rack physically fit here?”
It is:
“What operational function currently uses this space, and what happens when it disappears?”
Do not count required aisles as wasted space either
OSHA requires sufficient safe clearances for mechanically handled material and clear, marked permanent aisles.
Beyond that regulatory baseline, aisle geometry affects:
- forklift turning;
- pallet overhang;
- rack protection;
- pedestrian separation;
- passing behavior;
- cross-aisle turning;
- travel speed;
- visibility.
Density optimization has to preserve the complete operating envelope.
Warehouse density audit: the data to collect
- Gross building floor area.
- Area by functional zone.
- Storage-zone area by storage system.
- Installed pallet positions by zone.
- Blocked or permanently unavailable positions.
- Rack levels and top storage height.
- Safely usable storage height.
- Aisle widths and cross-aisle widths.
- Lift-truck model and required operating aisle.
- SKU count and pallets per SKU.
- Peak pallets on hand.
- Current location occupancy.
- Putaway and retrieval transactions by hour/day.
- FIFO, FEFO, lot and quality-hold rules.
- Fire-protection, rack-engineering and building constraints.
A practical warehouse density scorecard
For each layout option, record:
- installed positions;
- operationally usable positions;
- positions per 1,000 ft²;
- storage-area share;
- used storage height;
- direct pallet selectivity;
- expected peak occupancy;
- required lift-truck/automation system;
- sustained transaction capacity;
- installed CAPEX;
- CAPEX per net new usable position.
That creates a decision record that is much stronger than saying one proposal “adds 30% more density.”
When more density is probably valuable
Investigate higher-density storage when:
- rent or expansion cost is high;
- usable vertical space remains;
- inventory has many pallets per SKU;
- travel and access patterns support deeper storage;
- overflow warehousing is expensive;
- the current layout uses wide aisles relative to compatible equipment;
- capacity is constraining growth.
When maximum density is probably the wrong target
Be cautious when:
- SKU count is high and pallets per SKU are low;
- every pallet needs rapid direct access;
- inventory rotates under strict FIFO/FEFO rules;
- peak throughput matters more than stored quantity;
- staging is already constrained;
- rehandling cost is high;
- future product dimensions are uncertain;
- the denser system introduces substantial equipment or automation CAPEX.
The decision rule
Measure warehouse storage density with a clearly defined position count and floor-space boundary. Then keep occupancy, vertical use, selectivity and throughput beside it. The best layout is not the one with the highest possible position count; it is the one that creates the required capacity without making inventory harder, slower or less safe to move.
Frequently asked questions
How do you calculate warehouse storage density?
For pallet storage, divide installed pallet positions by the defined storage-zone floor area and multiply by 1,000. The result is pallet positions per 1,000 ft². Keep the area boundary identical when comparing layouts.
What is the difference between storage density and warehouse utilization?
Storage density describes how much physical storage capacity the layout creates inside a defined space. Occupancy or utilization describes how much of the usable operating capacity is currently filled.
Should I calculate density using the whole warehouse?
Usually not for layout comparisons. A defined storage-zone denominator makes rack-layout alternatives easier to compare because docks, offices, packing and other functions do not distort the metric. Whole-building storage-area share can be calculated separately.
What is a good pallet storage density?
There is no universal target. The appropriate density depends on aisle geometry, vertical use, pallet dimensions, handling equipment, SKU depth, selectivity, throughput and the storage system being used.
Does narrowing aisles always increase warehouse capacity?
Narrower aisles can create room for additional rack rows, but only when the selected handling equipment and load can safely operate in the reduced aisle. OSHA requires sufficient safe clearances for mechanical handling operations.
Does double-deep racking increase density?
It can. Double-deep storage reduces the number of access aisles required for a given number of pallet positions, but it also changes equipment requirements and direct pallet selectivity.
Does high-density racking always provide more usable capacity?
Not necessarily. Deep-lane systems can have high installed capacity but lose effective capacity when SKU quantities, FIFO rules or lane dedication leave locations unusable. Compare installed and operationally usable positions.
How do I measure vertical warehouse utilization?
Divide the highest routinely used storage height by the safely usable storage height. Do not assume the entire building clear height is available for storage.
Is warehouse cube utilization better than positions per square foot?
It answers a different question. Cube utilization can reveal unused vertical volume, but its denominator is easy to define inconsistently. Pallet positions per 1,000 ft² is often easier to audit for rack-layout comparisons.
How should I compare two warehouse layouts?
Use the same storage-zone boundary, inventory snapshot, pallet dimensions, throughput requirement and operating constraints. Compare usable positions, density, selectivity, vertical use, equipment, throughput and installed cost.
Sources and methodology
Warehouse Fieldbook uses pallet positions per defined storage-zone area as the primary density metric because it can be audited against the physical layout. OSHA 29 CFR 1910.176(a) is used for the safety boundary around mechanical-handling clearances and aisle condition. Raymond and Interlake Mecalux examples are used only to demonstrate how handling equipment, aisle width and storage depth can change density; their published dimensions and density effects are not treated as universal design rules. Storage-system selection must still be validated against the actual pallet, rack, lift truck, building and fire-protection design.
- OSHA — 29 CFR 1910.176, Handling materials — general
- Raymond — pallet-rack aisle dimensions by lift-truck application
- Raymond — Deep-Reach double-deep storage and aisle-reduction example
- Interlake Mecalux — very-narrow-aisle pallet-racking application guidance
- Interlake Mecalux — storage-system capacity, selectivity and effective-capacity considerations
- Interlake Mecalux — drive-in/drive-through high-density pallet storage
- Rack Manufacturers Institute (MHI) — industrial storage-rack resources and standards context