
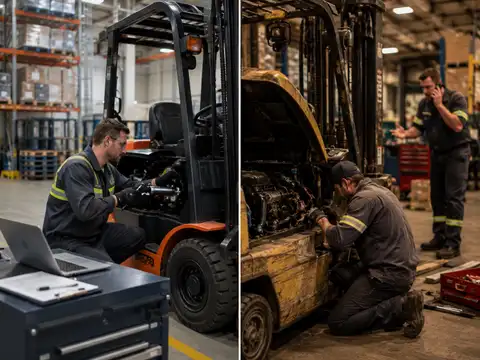
Pay for planned work before the equipment forces the timing.
Inspect, lubricate, adjust, calibrate and replace known wear items according to manufacturer/service requirements and measured condition. The objective is not “zero failures”; it is to reduce avoidable failures and move more work into controllable operating windows.
Best fit: critical or highly utilized equipment where breakdown timing, repair severity or parts delay has real operational cost.Repair primarily after failure.
Run-to-failure can be economically rational for noncritical, inexpensive, redundant assets when failure is safe, obvious, easy to repair and carries little collateral or downtime cost.
Bad fit: safety-critical equipment, single points of failure, long-lead-time components or assets whose failure damages adjacent systems.Scenario comparison
Preventive vs Reactive Maintenance Cost Comparator
Compare two user-defined annual scenarios. No failure reduction, PM interval, repair cost, downtime cost or preventive-maintenance ROI is preloaded.
Repairs + event-specific emergency cost + routine baseline service.
Breakdowns × downtime hours × user-entered hourly economic impact.
PM + residual repairs/emergency cost + tools/monitoring.
Planned disruption + residual-breakdown disruption.
Direct cash + modeled downtime impact.
Direct cash + modeled downtime impact.
Enter comparable assumptions.
Extra planned-program cost ÷ modeled reactive cost per breakdown. Diagnostic only.
Modeled portfolio total divided by covered assets.
Modeled portfolio total divided by covered assets.
OSHA and manufacturer requirements still control inspection, removal from service, repair authorization and hazardous-energy procedures.
Preventive vs reactive maintenance: direct comparison
| Decision factor | Preventive | Reactive |
|---|---|---|
| Timing | Work is scheduled from manufacturer intervals, condition, usage or risk. | Major work starts after failure or clear loss of function. |
| Budget predictability | Higher planned baseline; fewer costs should arrive as surprises. | Lower planned baseline; repair cash flow can be volatile. |
| Downtime | More work can be moved to low-volume or planned windows. | Breakdown timing is controlled by the failure, not the operation. |
| Parts | Wear parts and known failure modes can be staged before service. | Emergency parts availability and expedite cost matter more. |
| Labor | Technicians can arrive with planned scope and parts. | Troubleshooting and emergency call-outs can add time/cost. |
| Failure severity | Early detection can sometimes keep a small defect from becoming a larger repair. | Run-to-failure can allow secondary damage on some equipment. |
| Over-maintenance risk | Real: calendar PM can replace parts that still have usable life if condition/use data are ignored. | Low planned-service risk, but potentially higher breakdown exposure. |
| Best economic fit | Critical/high-use/high-downtime-cost assets. | Safe-to-fail, noncritical, redundant, inexpensive assets with easy replacement. |
Reactive maintenance is a real strategy—but only for the right failure modes
The U.S. Department of Energy's FEMP Operations & Maintenance Best Practices Guide describes reactive maintenance as essentially run it till it breaks.
That guide is broad federal-facility O&M guidance, not a warehouse-specific rule.
Its useful principle is that reactive can minimize planned maintenance activity while accepting more failure uncertainty.
DOE's 12–18% preventive-maintenance figure is historical context—not your warehouse savings target
FEMP's Release 3.0 published an estimated 12% to 18% cost savings over a reactive maintenance program for planned / preventive maintenance in its broad federal O&M framework.
The DOE figure comes from a 2010 federal O&M guide and is not a current warehouse-equipment benchmark, guaranteed saving or failure-reduction rate. Warehouse Fieldbook does not preload it in the calculator. Build the comparison from your own failure, repair and downtime data.
The biggest preventive-maintenance benefit is often control over timing
Toyota's current 2026 forklift telematics guidance says maintenance alerts can be based on:
- key travel activity hours;
- calendar triggers.
Toyota also recommends scheduling repairs during off-peak hours based on usage patterns.
That is economically important because the same one-hour service window can have very different operational cost at 2 p.m. peak shipping versus a scheduled low-volume window.
Preventive does not have to mean fixed calendar replacement
Toyota's May 26, 2026 telematics article specifically warns against unnecessary over-servicing.
It describes using real utilization and maintenance due signals rather than relying only on a set schedule.
This is the bridge from preventive toward condition-based maintenance.
Warehouse maintenance actually sits on a spectrum
Rational only where safe failure has low operational and collateral cost.
Service before failure based on manufacturer guidance, usage or recurring failure modes.
Use hours, cycles, temperature, vibration, current or inspection condition where available.
Strongest where sensors, history and failure consequences justify the added data system.
Interroll's 2026 guidance makes the preventive-to-condition-based transition explicit
Interroll's May 2026 conveyor / sorter guidance recommends preventive schedules based on manufacturer recommendations and operating conditions.
It also identifies condition monitoring with:
- vibration monitoring;
- motor current monitoring;
- temperature monitoring.
Interroll says condition-based monitoring can reduce both emergency repairs and unnecessary preventive replacements.
Current equipment can expose actual service-life signals
Interroll's current RollerDrive EC5000 with bus interface can indicate when calculated service life is reached based on actual application conditions.
Interroll says this allows maintenance to be planned in low-demand periods while helping avoid unexpected downtime.
It also records:
- start cycles;
- powered time;
- running time.
Forklifts need a safety floor below the economics
OSHA 1910.178(q)(7) requires powered industrial trucks to be examined before being placed in service at least daily.
For round-the-clock use the examination is required after each shift.
Defects affecting safety must be reported and corrected.
An unsafe forklift is not a valid run-to-failure candidate
OSHA 1910.178(q)(1) says a powered industrial truck not in safe operating condition shall be removed from service.
Repairs shall be made by authorized personnel.
A spreadsheet cannot override removal-from-service requirements. If a defect adversely affects safe operation, the reactive scenario is not “keep operating until a cheaper time.” Restore the equipment to safe condition before returning it to service.
Covered maintenance also needs hazardous-energy control
OSHA 1910.147 covers hazardous energy control during covered servicing and maintenance.
A preventive program that increases intervention frequency without safe isolation procedures is not good maintenance.
Crown recommends watching the PM-to-breakdown ratio
Crown's current fleet maintenance analytics guidance says to determine the Planned Maintenance (PM) to Breakdown Ratio.
Crown says if breakdown invoices are greater than planned maintenance event invoices, the program may have a problem.
Crown also says its data show average forklift service work orders between five and nine per year depending on equipment type and application.
Both are Crown fleet benchmarks, not universal warehouse targets.
Breakdown count alone is not enough
Compare:
- breakdowns per 1,000 operating hours;
- average direct repair cost per event;
- average downtime per event;
- repeat failures;
- emergency call-out share;
- parts expedites;
- rental / contingency use;
- planned-maintenance hours;
- planned-maintenance findings that prevented larger failures.
An asset with two cheap 20-minute failures is different from one failure that stops outbound shipping for six hours.
When reactive maintenance can be economically rational
Failure does not stop the operation.
Another identical unit can absorb the load and repair can wait for normal service without service-level impact.
The failed component is inexpensive and quick to swap.
Preventive replacement can consume useful life without materially reducing operational risk.
The failure is obvious and isolated.
It does not silently degrade safety, damage connected equipment or create a cascading material-flow failure.
When preventive maintenance deserves priority
One failure stops a dock, sorter, conveyor zone or essential truck.
Downtime exposure can exceed the technician/parts cost of the failure itself.
A small worn part can damage a larger assembly.
Planned replacement can be justified by avoiding a more severe repair rather than by reducing event count alone.
Failure parts cannot arrive quickly.
Inspection and condition monitoring can create the lead time needed to order before the component reaches functional failure.
Failure can adversely affect safe operation.
Regulatory/manufacturer requirements establish a maintenance floor independent of the financial comparison.
Preventive maintenance can fail economically through over-servicing
More maintenance is not automatically better maintenance. Common over-maintenance patterns include:
- replacing parts strictly by calendar despite very low utilization;
- duplicating vendor PM and internal maintenance;
- performing intrusive maintenance that creates new failure opportunities;
- servicing every asset at the frequency needed only by the highest-use units;
- ignoring actual condition / sensor data.
Toyota's current telematics guidance explicitly identifies avoiding unnecessary over-servicing as a potential benefit of data-driven maintenance.
Reactive maintenance can fail economically through emergency premiums
A breakdown can add:
- after-hours or emergency technician response;
- expedited parts freight;
- temporary rental;
- production / shipping interruption;
- overtime for recovery;
- secondary equipment damage.
The calculator keeps direct repair and monetized downtime separate so the business can see which assumption drives the result.
How to value downtime without creating fake precision
Use a supportable hourly economic impact based on the actual constraint.
Examples:
- incremental rental / overtime needed to recover;
- lost contribution margin from throughput that cannot be recovered;
- documented service penalty exposure;
- incremental labor idle time that cannot be redeployed.
Do not add all four if they describe the same economic loss.
Do not use generic internet claims such as “warehouse downtime costs $X per hour” unless they genuinely match your operation. The calculator defaults downtime value to zero so a user must supply a supportable figure.
Break-even failures avoided is often the cleanest decision metric
If a preventive program costs more than the reactive baseline, ask how many modeled breakdowns must be avoided for that extra planned spend to pay for itself.
The comparator calculates this diagnostic from the entered reactive cost per breakdown.
It does not assume the preventive program actually achieves that reduction.
Use three residual-failure scenarios
Use this to test whether the program still makes sense for safety, severity reduction or planned timing even if failure count improves little.
Do not create the base case from a vendor-wide percentage when asset condition and duty are known.
The upside case should not silently become the approved budget case unless operating evidence supports it.
Measure preventive findings, not just preventive labor hours
A PM program can appear expensive if the only KPI is technician hours.
Record:
- defects found before failure;
- wear parts changed;
- adjustments / lubrication completed;
- condition trend;
- follow-up repairs generated;
- breakdowns after PM;
- repeat failures after repair.
This separates useful preventive work from routine visits that generate little value.
Critical spares can be more valuable than extra PM
For some failure modes the right strategy is not “more preventive replacement.”
It is “let the safe-to-fail component run and keep the replacement part on site.”
This can preserve component life while controlling lead-time risk.
Use the maintenance budget planner to fund whichever strategy wins
After selecting the strategy, move the approved annual scope into How Much Should a Warehouse Budget for Equipment Maintenance?.
That tool separates:
- PM;
- inspections;
- wear parts;
- corrective reserve;
- spares;
- call-outs;
- known backlog;
- continuity reserve.
Dock equipment is a good example of mixed strategy
A dock program can use:
- planned inspection / lubrication for levelers and restraints;
- condition-based replacement for wear components;
- reactive replacement for safe, noncritical accessories;
- critical spares for parts whose lead time threatens dock availability.
For the cost structure see Loading Dock Maintenance Cost.
Preventive-vs-reactive strategy audit
- Asset register complete.
- Asset criticality assigned.
- Safety-critical failure modes identified.
- Manufacturer/OEM maintenance requirements reviewed.
- Regulatory inspection/maintenance requirements reviewed.
- Last 12–24 months of work orders normalized.
- Breakdown events per operating hour/cycle.
- Direct repair cost per breakdown.
- Average downtime per breakdown.
- Emergency call-out / expedite / rental cost.
- Repeat-failure rate.
- Collateral-damage potential.
- Parts lead time.
- Redundancy / backup capacity.
- Failure detectability.
- Safe-to-fail classification.
- Current PM intervals.
- Current PM cost.
- Current planned downtime.
- PM findings / defects caught before failure.
- Over-servicing evidence.
- Condition-monitoring signals available.
- Telematics / usage hours available.
- Vibration / current / temperature monitoring where useful.
- Critical spares strategy.
- Downtime economic value supported.
- Downtime double-count check.
- Reactive annual scenario calculated.
- Preventive downside scenario calculated.
- Preventive base scenario calculated.
- Preventive upside scenario calculated.
- Break-even avoided failures calculated.
- Safety boundary applied before economic comparison.
- LOTO / hazardous-energy procedure confirmed for covered service.
- Pilot / phased maintenance change planned.
- PM-to-breakdown ratio monitored after implementation.
- Quarterly actual-vs-model review.
Compare preventive and reactive maintenance with operating data
Preventive versus reactive is a real economic comparison when the operation has its own data.
The comparator deliberately does not preload:
- a preventive failure-reduction percentage;
- a reactive failure rate;
- a PM interval;
- a downtime value;
- a DOE 12–18% saving;
- a generic warehouse downtime cost.
The user must enter the expected residual breakdowns under preventive maintenance, making the key uncertainty visible.
The decision rule
Use reactive maintenance only for failure modes that are safe, isolated, inexpensive and operationally tolerable. Use preventive maintenance where failure timing, repair severity, downtime, parts lead time or safety exposure makes an unplanned event expensive. Then refine calendar PM with hours, cycles, condition and telematics so the program does not over-service low-use assets. Compare direct repair cost and monetized downtime separately, scenario-test the residual failure rate, and monitor the PM-to-breakdown ratio after implementation. The best program is usually a portfolio of strategies by failure mode—not an all-preventive or all-reactive policy.
Frequently asked questions
Is preventive maintenance always cheaper than reactive maintenance?
No. Preventive maintenance adds planned cost and can over-service low-risk assets. It becomes economically stronger when it avoids sufficiently expensive failures, reduces repair severity or moves downtime into lower-cost windows.
Is reactive maintenance ever a good strategy?
Yes for safe-to-fail, noncritical, redundant and inexpensive components where failure is obvious, easy to repair and does not create collateral damage.
How much can preventive maintenance save?
There is no universal warehouse percentage. A DOE FEMP guide published in 2010 cited an estimated 12–18% saving over reactive maintenance in a broad federal O&M context. Warehouse Fieldbook treats that as historical context, not a warehouse savings assumption.
What is the break-even point for preventive maintenance?
One useful measure is the extra annual planned-program cost divided by the modeled economic cost of one reactive breakdown. That estimates how many breakdowns must be avoided for the extra planned spend to break even.
How do I estimate warehouse equipment downtime cost?
Use supportable incremental cost or lost contribution for the actual constrained process. Avoid generic internet downtime values and avoid counting the same loss more than once.
Should forklift maintenance be reactive?
Safety-critical defects cannot be treated as run-to-failure choices. OSHA requires daily/shift examinations as applicable and removal from service when a powered industrial truck is not in safe operating condition.
What is condition-based maintenance?
It schedules intervention from measured equipment condition rather than from failure alone or a fixed calendar. Examples include hours/cycles, vibration, temperature, motor current and inspection condition.
What is predictive maintenance?
Predictive maintenance uses trends, telemetry or analytics to identify emerging failure risk and plan intervention before functional failure. It is most useful where reliable data and significant failure consequences justify the additional system.
Can preventive maintenance become wasteful?
Yes. Replacing components too early, duplicating service, using one interval for all utilization levels or ignoring actual condition can create unnecessary cost.
What should I track to compare preventive and reactive maintenance?
Track breakdown events, operating hours/cycles, repair cost/event, downtime/event, emergency spend, PM cost, planned downtime, PM findings, repeat failures and the PM-to-breakdown ratio.
Should critical spares be part of the strategy?
Yes when a safe-to-fail component has a long parts lead time or creates substantial downtime exposure. A local spare can be more economical than replacing the part early on a fixed schedule.
How should I budget after choosing the maintenance strategy?
Use the warehouse equipment maintenance budget planner to aggregate the chosen PM, inspections, wear parts, corrective reserve, spares, call-outs, backlog and continuity costs.
Sources and methodology
The U.S. Department of Energy FEMP Operations & Maintenance Best Practices Guide, Release 3.0, supplies the historical run-to-failure definition and its broad 12–18% planned-maintenance savings estimate; the article explicitly identifies that guide as 2010 federal-facility context rather than a warehouse benchmark. OSHA 1910.178 supplies the powered-industrial-truck daily/shift examination, unsafe-equipment removal and authorized-repair boundaries. OSHA 1910.147 supplies hazardous-energy-control context for covered servicing/maintenance. Toyota's May 26, 2026 telematics guidance supplies current utilization/calendar maintenance alerts, off-peak repair scheduling and over-servicing context. Crown's current fleet-maintenance analytics guidance supplies its PM-to-breakdown ratio and five-to-nine-work-order fleet dataset examples, which are treated as Crown data rather than universal targets. Interroll's May/June 2026 conveyor guidance supplies current manufacturer/operating-condition PM and condition-monitoring examples; Interroll's current EC5000 documentation supplies its application-condition service-life signal and low-demand maintenance-planning example. The calculator is Warehouse Fieldbook methodology and preloads no failure rate, savings percentage, PM cost, residual-failure assumption or downtime value.
- U.S. Department of Energy FEMP — Operations & Maintenance Best Practices Guide, Release 3.0
- OSHA — 29 CFR 1910.178 Powered Industrial Trucks
- OSHA — Control of Hazardous Energy / 29 CFR 1910.147
- Toyota Material Handling — May 26, 2026 forklift telematics / maintenance guidance
- Crown — current maintenance analytics / PM-to-breakdown guidance
- Interroll — May 27, 2026 preventive / condition-based maintenance guidance
- Interroll — June 10, 2026 preventive maintenance / spare-parts guidance
- Interroll — current EC5000 service-life / maintenance-planning data